All posts by bpsadmin

Cross-viewing improves ASIC & FPGA debug efficiency

We introduced the philosophy behind the Blue Pearl Software suite of tools for front-end analysis of ASIC & FPGA designs in a recent post. As we said in that discussion, effective automation helps find and remedy issues as each re-synthesis potentially turns up new defects. Why do Blue Pearl users say their tool suite is easier to use than other linting and CDC tools?

An effective ASIC & FPGA design flow integrates analysis tools with the main EDA environment, minimizes jumping back and forth between tools, but allows flexibility in how results are obtained. In what Blue Pearl terms “continuous integration”, code review is automated to a manageable rule set so coding standards are enforceable across teams and projects. While automated testing is fast and thorough, the key to productivity is how debug information is managed and resolved. Analysis tools that present accurate results quickly and clearly soon become part of a designer’s trusted environment.

All debug results produced by the Blue Pearl testing suite – including Analyze RTL, Clock Domain Crossing (CDC) analysis, and a Synopsys Design Constraints (SDC) management tool – are presented in a GUI with cross-linked viewers. Tcl scripts are also supported via a command line interface (CLI), and analysis jobs run from the CLI can have their results viewed in either the GUI or the CLI.

The power of the Blue Pearl GUI is its cross-viewing capability. Most linting tools spit out endless lists of text messages, usually linked to a view of source code. CDC tools typically provide text messages with a link into a schematic window illustrating the problem. Messages are often cryptic, and without context sometimes determining the exact severity of a problem is difficult.

One of the Blue Pearl customer presentation slides starts out with this: “Getting an error message is only part of fixing problems.” Unique to the Blue Pearl suite is how everything is tied together and manageable, allowing the user to visualize any issues and see in what context they occur. The obligatory text message window is at the center, but reimagined with meaningful messages linked to a line of code and cross-linked to several other viewer windows.

Blue Pearl debug views

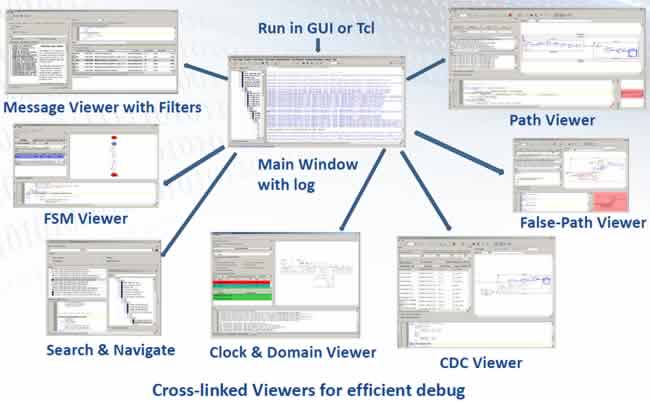
Messages from the main window can be narrowed down by grouping or user-defined filtering in the message viewer window. This is critical to any linting system; some errors are really warnings, others are severe and require design changes. Users can find what errors demand action quickly, rather than sifting through a long list with eyeballs and hoping to catch everything.

More powerful contextual capability is represented in several other windows.

  • Finite state machines (FSMs) have their own viewing window, clearly showing terminal or unreachable states.
  • Clocks and domains have their own window, under the presumption that some issues are related to how clocks and domains are set up.
  • CDCs also have their own window to view the synchronizer constructs in detail.
  • Pruned schematics and highlighted paths have windows so errors can be visualized in their context, and tracing can follow a signal forward or backward in the code to help identify the source of the problem.
  • False paths have their own view for individual treatment.
  • A search and navigate window helps find signals, objects, or hierarchical relationships quickly.

Cross-viewing capability in the Blue Pearl suite allows errors to be understood and solved quickly. RTL issues can be uncovered pre-synthesis, and CDC problems difficult to detect at all in simulation can be identified and handled. Compare this approach to post-synthesis debug that has to go all the way around the loop and may still not completely resolve the actual source of the error, requiring another debug and synthesis pass.

We’ll discuss the Tcl script interface and message filtering and waiver system more in our next post describing the Blue Pearl 2016.1 release features.

FPGA tools for more predictive needs in critical

“Find bugs earlier.” Every software developer has heard that mantra. In many ways, SoC and FPGA design has become very similar to software development – but in a few crucial ways, it is very different. Those differences raise a new question we should be asking about uncovering defects: earlier than when?

Structured development methodology was a breakthrough in computing, leading to the idea of structured programming and modular approaches to code. Systems engineers banished “goto” statements and embraced data flow diagrams, defining system inputs and outputs that can in turn be exploded into more detailed low-level functions with their inputs and outputs defined. Functions are decoupled such that a change in one does not affect others, and abstracted so that its design details are kept from the rest of the system. They are coded and tested stand-alone, then connected into subsystems, then the system, and everything usually works as expected.

The results of structured programming are rather spectacular. Code is easier to develop, easier to test, more reusable, and more manageable. Initial development time shrank, but a bigger impact is on the lifecycle – enhancements and maintenance tasks went from huge problems to achievable objectives. Capturing and understanding programming metrics brings predictability to the software development lifecycle (SDLC). Once requirements are determined, teams can accurately size a project, load resources, and estimate a schedule.

Those all sound like great things, especially for teams working on anything labeled “-critical”. Whether the job is mission, life, or safety, the approach is similar. Teams in mil/aero, medical, and industrial segments usually seek structured processes and procedures to reduce schedule and risk through planning, visibility, and predictability. Requirements are usually carefully bounded and traceable, and once frozen even minute changes come under intense scrutiny.

In contrast, more modern agile methods can produce stunning results where requirements are more dynamic. Defects are more of a continuous stream, popping up quickly and receiving immediate attention. Agile teams tend to value working software over documentation, and often have difficulty accurately projecting completion dates. Adaptive methods are often just too much entropy for risk-adverse teams and customers in the critical realm.

Predictive_sdlc_vs_Adaptive_sdlc

Tension between adaptive and predictive methods shows up prominently in FPGA design. FPGAs are the ultimate in adaptive hardware, taking shape around a user-defined design. The process at first appears structured, with high-level hardware description languages and reusable blocks of IP and automated synthesis tools. Entropy creeps in as a virtual representation of a design – even one heavily simulated – is translated into physical constructs in the FPGA. What were known good functional blocks can suddenly break down at integration and hardware debug, victims of a variety of rule violations and anomalous behavior.

Without effective automation, finding and remedying those behavioral issues turns into a random manual exercise. The problems worsen incrementally, as new changes and re-synthesis can result in new unforeseen defects. The question of “earlier than when” becomes causal, with the schedule clock and expectations for a predictable result restarting as changes are planned and integrated. The job is finding critical bugs right now, prior to beginning each synthesis run, quickly verifying the entire FPGA design through accurate testing and regression analysis.

What kind of things crop up in an FPGA? Most vendor-supplied synthesis tools weed out the simple design rule violations, but more sophisticated checks are needed for bus contention, register conflicts, and race conditions. Another issue is related to clock domains and what happens when logic crosses them, resulting in potential metastability issues. High-performance tools can check and insert synchronizer constructs and re-timing logic, an area where FPGA design teams often become mired without automation assistance. Re-timing and synchronization are excellent examples of things that can change at each iteration, and unchecked can lead to problems.

Automating critical manual processes in FPGA verification is the entire mission for Blue Pearl Software. Using a TcL shell, a graphical front end for all Blue Pearl tools manages results from advanced analysis engines and presents information visually. Analyze RTL provides static design and rule checking, a CDC tool analyzes clock domain crossings (CDCs) using patent-pending User Grey Cell modeling and other techniques, and an SDC tool handles Synopsys Design Constraints – all before time-consuming synthesis, improving result quality and shortening the overall design cycle with fewer iterations. Integration with industry-standard tools and flows on either Windows or Linux means the FPGA design process is enhanced, not completely altered.

Perhaps just as important as finding more actual errors quickly is sorting and filtering them by severity, up to and including not reporting items that do not present an actual problem – often the case in CDC analysis. By managing reporting within the Blue Pearl suite, design teams are led to issues requiring direct attention, and not bothered by items of limited or no importance. Results are presented in an executive-friendly dashboard and a design cycle manager, improving visibility and aiding teams used to higher levels of predictability.

Some applications are overtly declared -critical, but as I’ve been sharing lately, applications such as the connected car, the IoT, and wearables are also taking on increasing expectations. Accelerating verification is really about finding bugs right now, before declaring an FPGA design ready for synthesis – at every iteration of the design. Predictability is worth an extra step. In future posts, we will drill down into the capability of the Blue Pearl Software suite of tools and how they support industry-standard FPGA design flows including integration services.

Where Does RTL lint tool fit in my design flow?

Where Does RTL lint tool fit in my design flow?Working with ASIC and particularly FPGA designers, I’m frequently asked if finding bugs using existing simulation or emulation tools is sufficient. The short answer is “Yes”,but it’s not always the most efficient. As design sizes increase but schedules do not expand to match, designers find themselves frustrated by spending too much time looking at simulation results or on bench testing to find bugs. Recently a mil aerospace customer lamented that, aside from enduring the process of re-planning and resetting schedules, and the risk of having a project cancelled for being 2+ weeks late, it’s very embarrassing to explain to management that the mistake turned out to be just some unconnected nets that could easily have been found by a lint tool in mere minutes.

That is why customers now rely on lint or structural analysis tools like the Blue Pearl Software Suite in order to accelerate their IP and FPGA designs. Our tool suite includes RTL design analysis – linting, clock domain crossing (CDC) analysis and automatic timing constraint (SDC) generation.

We analyze the Verilog or VHDL and looks for situations that can cause design failures, such as a net that is undriven. This could cause an unknown state that would have to be debugged through a simulation wave forms viewer. A CDC crossing without a synchronizer will cause design failures that simulators might never catch at all.

Naturally, the next question I’m frequently asked is how and where Blue Pearl fits in one’s design flow:

  • Before Simulation –Blue Pearl can be used after initially writing the code. By using Blue Pearl to find design errors in the code, the designer can quickly check the language compliance and look for errors that can cause simulation failures. These errors can be found before developing a testbench.
  • Before Synthesis – Blue Pearl looks for code that could be un-synthesizable or could cause post-synthesis simulation results that are different from pre-synthesis simulation.
  • When generating constraints – After clock domain crossing synchronization has been added,Blue Pearl shows a visualization of the clocks and clock domains to help the user generate correct clock and clock domain constraints.
  • After CDC Synchronization Insertion –Blue Pearl looks for Clock Domain Crossing Synchronizers and determines where they are missing.
  • After Synthesis–Once it has been implemented,Blue Pearl can be used to visualize the RTL that caused a violated timing path. This can be done using a timing report that identifies the violated timing paths.

Blue Pearl can be used to easily and quickly find bugs that can hold up the design process. This is done early in the flow, when code is just being written, and after it has been implemented and when ECOs changes have to be made.

If you have any questions, comments, war stories, or compliments, please feel free to drop me a line. Bart@bluepearlsoftware.com

Nice to be back, especially at DAC 52

Did you stop by booth # 832 and check out Blue Pearl Software’s awesome new and improved RTL debugging environment version 9.1? If not, hopefully you took a spin down Central Park on our big screen, won an Apple watch, or at least picked up our tchotchke for your little ones at home.

bluepearlsoftware-team-booth

As for me, attending Design Automation Conference 2015 (52nd DAC) was a nostalgic but exciting trip down the memory lane. Can you name the company that boasted the largest, over 10,000 installed base of EDA users in 1988? It was Personal CAD Systems (P-CAD), where my EDA career began, and where I first worked with Blue Pearl Software’s fearless CEO, Ellis Smith. Yeah, I was 12 at the time (ha, ha), and I answered a newspaper ad for a sales support manager position (for real).

When P-CAD was acquired by CADAM, an IBM subsidiary in 1990, my job shifted from sales supportto marketing following the rebranding of CADAM that became ALTIUM, an IBM Co. in the spring of 1993. Somewhere around 1995 I think, IBM signed an exclusive agreement to have ALTIUM market and distribute its high end EDA tools that were previously proprietary and highly coveted by the commercial EDA community. I was the ALTIUM marketing manager who was lucky enough to launch the announcement at DAC in Dallas. It made DAC’ headline news, and boy, was the party fun at the Dallas World Aquarium!

When I reconnected with Ellis and Blue Pearl in May, I couldn’t wait to see the growth and changes that have taken place since I left EDA in the mid-90s. Overall, DAC seems to have gotten smaller, although still lively, because the industry has consolidated so much. Many exhibitors including Blue Pearl continued to host our own private demo booths, which is not typical of most shows nowadays. I was just at the RSA Conference, a security show in April, for example. There, you only saw cool tools, lots of tchotchkes, and enough free food to justify skipping dinner and going straight to the bars.

Enough looking back, I’m amazed to see so many EDA colleagues who are still in the industry, including the late, long time industry analyst Gary Smith whose loss will be missed. No more mandatory attendance at DAC’s kick off reception where Gary shares his annual EDA predictions.No more listening to Gary playing his bass to some good old blues.

I’m grateful to have met lots of new faces that stopped by our booth. Big thank you to the VIPs who booked private demos. Hopefully, the time you got to spend with our VP of R&D Scott Bloom provided insights and food for thought.Big congrats to our three Apple Watch winners: Johnny Kwei of Broadcom, Richard Cheung of Oracle, and Duncan Halstead of Western Digital!.

resized-image-3 resized-image-1 resized-image-2

Thanks for reading my first blog post since coming back to EDA. I’m looking forward to contributing to Blue Pearl Software’s growth by sharing relevant info that will help you accelerate your RTL design and debug. So, how about showing a little love and connect with us on LinkedIn, Facebook and Twitter?

Brian Daellenbach, President of Northwest Logic

“Using Analyze, we have identified and resolved coding issues that help us maximize the quality of our IP Cores”

Carl Ruggiero, CEO, Trilinear Technologies.

“Blue Pearl Software’s latest capability allows us to selectively weigh logic elements and rapidly determine the longest paths rather than wait for long and expensive synthesis runs, thus enabling us to provide reliable products while reducing our design cycle.”

Samir Shroff, VP Engineering, Sibridge Technologies.

“Blue Pearl Software’s latest tool allows us to rapidly view design analysis results, including clock domain crossings and timing constraints, ensuring that our customers receive the highest quality verification IP available at this time.”

Steve Presant, VP of Engineering, C2 Microsystems

“Blue Pearl has allowed us to create a low risk, predictable development cycle that helps generate accurate RTL code, reducing time-consuming iterations.”

Joe Dao, CAD Manager, Aeluros

“Create quickly generated timing exception constraints that improved the timing on our design by 30% after synthesis and placement in a Magma flow.”

Jauher Zaidi, CEO Palmchip Corporation

“We use Create to generate timing exceptions for our challenging design blocks for Palmchip SoC Platform and IP blocks and have found that Create runs very fast and produces accurate constraints at RTL.”