
They say with a chain, it is only as strong as its weakest link. The same can be said about an EDA tool chain for developing and verifying FPGA and ASIC designs. In fact, one of the most significant challenges in the development of a design is verification, and surprisingly it is not the home-grown portions of code, it’s typically the verification of 3rd party IP cores in the context of the overall design.
On average, most designs bring together between 50 to 100 different IP cores that must be integrated as part of the overall chip. In many cases, designers who are doing the integration neither have access to the core source code or if they do, do not have a deep understanding as to how it works. This adds tremendous difficulty during integration and verification.
It thus becomes incumbent upon EDA providers to alleviate verification bottleneck with new methodologies and functionality. This is exactly what Blue Pearl Software has done for Clock Domain Crossing (CDC) analysis with its patented User Grey Cell technology.
CDC analysis involves finding issues which will result in metastability within Flip Flops (FFs) because of data crossing clock boundaries. Unsynchronized CDCs represent the bulk of the problem for FPGA and ASIC failures in the field according to recent studies. The Visual Verification Suite identifies unsynchronized CDCs with source clock, destination clock and target FFs information so they can be quickly found and fixed.
So, what’s a Grey Cell?
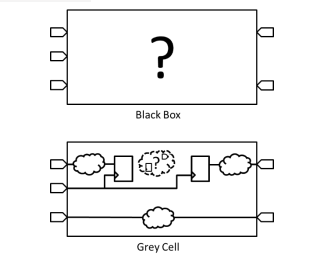
A Grey Cell, as depicted in Figure 1 below, is a representation of a module which excludes all register-to-register logic. A grey cell model is an abridged version of a piece of IP that allows for CDC analysis of the interface to the IP while simplifying the overall system analysis, significantly reducing run times while concealing the proprietary content of the IP. It’s in essence one step beyond a black box, with only one clock cycle’s worth of circuitry inside. It consists of all the ports of the IP (which is where a black box stops), plus all the logic between the input ports and the output of the first register, and the last register plus all the logic from there to the output ports.
Any combinational paths through the block are also preserved, as well as all logic driving the clocks and resets of those input and output registers. Everything else is removed from the model. Thus, the only information required is the names and directions of the I/O ports, which ports are clocks and resets, and which clock and reset are associated with each I/O port’s register.
There are several ways to create a Grey Cell model. You could write it from scratch in RTL using the information outlined above. You could also start with the entire module, proprietary parts and all, analyze it, and throw away everything not needed for the grey cell model. This second method is used when a module is given a grey cell attribute, so the tool ignores the detailed model. Lastly is the creation of a “User Grey Cell”, which is an XML library file, readable by the Visual Verification Suite, that contains only the necessary information. The Visual Verification Suite’s Grey Cell editor streamlines this process.
To streamline CDC analysis for FPGAs, Blue Pearl is integrated with and ships with Grey Cell libraires for many of the AMD/Xilinx and Intel cores provided in the Vivado ML Editions and Quartus Prime design software suites.
A Grey Cell differs from a black box in that a black box has no logic inside. With a black box, you can analyze connectivity only. Grey cells enable the analysis of CDCs in module-to-module connections while masking the details and preserving the trade secrets of the original IP provider.
Accelerating CDC Analysis with a dramatic reduction in runtime
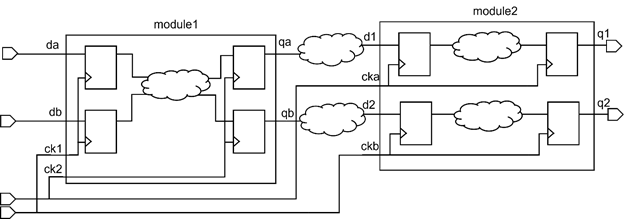
To illustrate how Grey Cells improves CDC analysis accuracy while dramatically reducing runtimes, consider the diagram shown in Figure 2 where the entire RTL descriptions of “module1” and module2” are available. It is apparent that both outputs of module1 should be synchronized, since ck1 is connected as the input clock and ck2 as the output clock. Also, synchronization is required at the d2 input of module2, since ckb is connected to ck2. There are no CDCs within module2. Since all the details are known, a CDC analysis will reveal whether synchronization has been properly implemented, but the analysis may take a long time if both modules are large and complex.
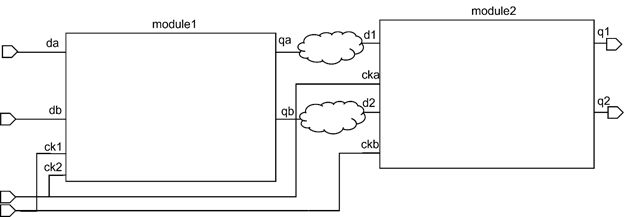
In Figure 3, both module1 and module2 have been replace by black boxes. All information about which clock is associated with which data pin has been lost. In fact, it’s only by guessing based on the signal names that you might infer that each module has two clocks. In this example, CDC analysis is not possible.
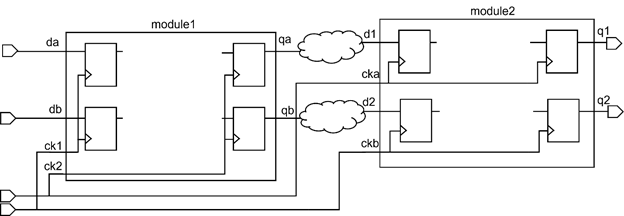
Now with a Grey Cell version shown in Figure 4, the interior details of both modules are unavailable, but the identity of the clocks and their relationships to the data inputs and outputs are known. With this, you can infer the need for synchronization within module1 given that all the inputs have a different clock than all the outputs, but you need to trust that this has been done properly. Within module2, synchronization may or may not be needed; there is no way to tell. The truth is, if these modules are both 3rd party IP, you couldn’t make the necessary changes to fix any issues that did exist. Those issues remain the responsibility of the vendor.
However, the CDC at the d2 input of module2 can be detected and dealt with despite not having full details about the interior design of each module. In addition, the analysis will not be slowed by analyzing interior details that can’t be fixed anyway.
The Visual Verification Suite also supports the IEEE 1735 encryption standard, however encrypted information can be decrypted by bad actors, absent information can’t. This makes a User Grey Cell model inherently more secure with the added benefit of significantly improved run times.
If your CDC analysis tool is taking too long and is no longer handling complex designs or is just so hard to use that it doesn’t get used, then it just might be the weakest link in your tool chain. If so, it’s time for a change! We would be happy to show you why Blue Pearl customers have chosen to our Grey Cell technology along with the Visual Verification Suite for tackling CDC issues in the most complex designs.
Request a demo to learn more.