Our FPGA and SoC designs are increasingly complex and used for a wide range of applications from autonomous driving to image processing, machine learning, defence, aerospace and space applications.
Of course, while complexity has increased the available development time has been static or reduced. Indeed, both the AspenCore embedded survey 2017 and 2019 indicate the two largest challenges in delivering a project are meeting schedule and debugging the application[1].
When it comes to developing our FPGA and SoC based solutions, just like in any engineering endeavour the earlier we can identify issues the easier, timelier and less costly they are to address.
Early identification of issues within our FPGA or SoC design is where Blue Pearl Software comes into its own. If this is the first time you have come across Blue Pearl, their suite of verification tools enables us to Visualize the design, Verify the structure and Validate the design.
In this series of blogs, we are going to explore how we can use Blue Pearl’s Visual Verification Suite™ and leverage its capabilities to assist in our FPGA/SoC designs.
In this first blog we are going to start at the very beginning and look at what design visualisation features = the suite offers to use as FPGA/SoC Designers.
Blue Pearl’s visualisation of the design enables us to perform the following:
- Analyze RTL™ linting and debug – This enables us to ensure coding standards are followed, analyse the design for several structural issues, verify the design complies with manufacturer coding standards e.g. Xilinx Ultrafast Methodology, run path analysis and explore finite state machines.
- Clock Domain Crossing – Analyse design and clocking structures to ensure CDC is implemented correctly in the design.
- Automated SDC generation – Identified false paths and multi-cycle paths in your design and generated the appropriate SDC file.
To provide visibility of the results of the analysis and verification checks the Management Dashboard is provided.
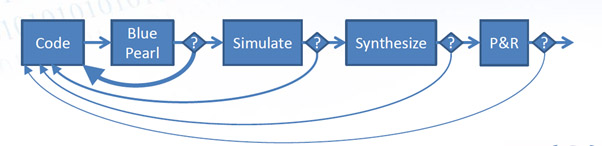
In the remainder of this blog we are going to look at where in the development cycle we should use the Blue Pearl suite, and how we can get started with our first design.
As I mentioned previously, the earlier we can identify issues the easier and less costly they are to address. As such we should be using Blue Pearl throughout the development of the HDL prior to starting simulation.
Of course, the following stages of development simulation, synthesis and place and route can result in RTL changes. If there are RTL changes, we should re run the Analyze RTL to ensure no issues have been introduced.
https://m.eet.com/media/1246048/2017-embedded-market-study.pdf
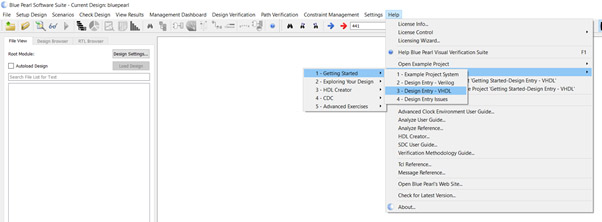
Once we have the Visual Verification Suite Installed (you can get a evaluation copy here) the next step is to open the suite and then open the getting stated design example.
To open the getting started example we should select Help->Open Example Project -> Getting Started and then select your preferred language VHDL or Verilog. As I am a VHDL user I will open the VHDL design entry example.
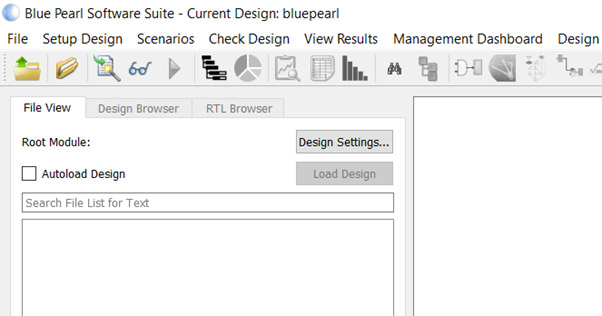
To load in the design files, we need to select the Design Settings button
To actually add RTL files, we need to click on the green add file option under the Design Files option
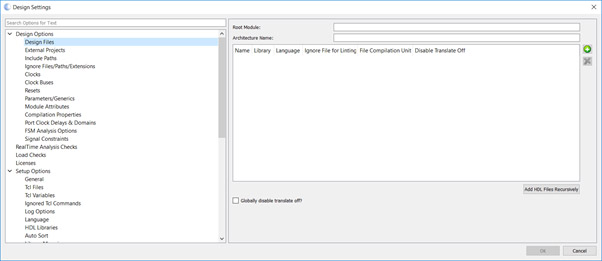
Once all the source files are added, click on OK and the click on load design back on the suites start page. After a few second you will see the design has loaded and that there are no errors but some warnings.
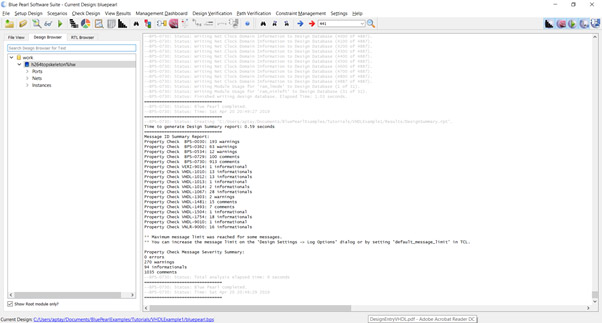
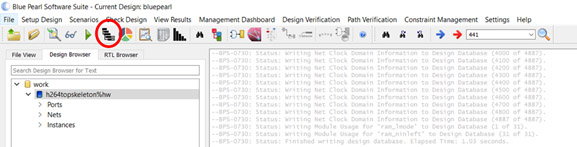
With the design loaded we can start examining the RTL design analysis. The first step of which is to open the Real Time Analysis and Dependency viewer.
We can open the Real Time Analysis viewer by clicking on the highlighted button below.
This will open the Real Time Analysis and Dependency viewer. The dependency viewer does not outline the hierarchy instead it outlines how the files are interrelated.
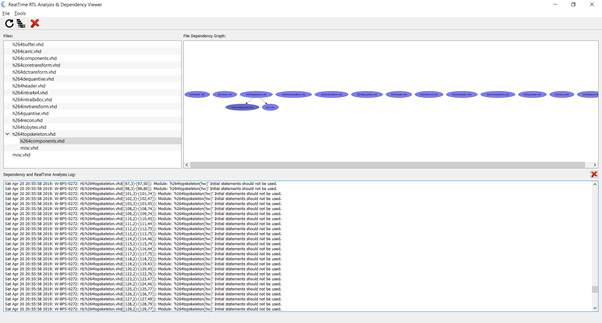
Understanding this interrelationship is very useful when we come across issues during design loading.
Now we have our design loaded we are ready to start exploring our design space using the suites analysis and design checking options.
We will start looking at these in the next blog soon!